Moonboys and Degens Unite in Laughter

Welcome to Acronym Meaning!

A blog dedicated to every moonboy and degen navigating the wild world of crypto. Here, we share insights, stories, and laughter for those who’ve faced the ups and downs.

A hand holding a smartphone displaying a cryptocurrency trading application. The screen shows a candlestick chart for BTC/BUSD with a price of 36,437.00, as well as other information like the order book, market history, and margin data. The background has a two-tone color scheme with blue on the left and light gray on the right. The person is wearing a pinkish-red long-sleeve shirt.

150+

15

Join the community!

Crypto enthusiasts

Gallery

A close-up view of a smartphone displaying a cryptocurrency trading app with a graph showing the price movement of LUNA/USDT. The phone screen shows the current price, percentage change, and volume. The background is blurred with colorful digital charts, suggesting a trading environment.
A laptop on a table displaying a cryptocurrency trading platform. The screen lists various cryptocurrencies along with their buy and sell values, spread percentages, and 24-hour change percentages. The keyboard and touchpad of the laptop are visible, set against a neutral background with a sofa in the back.
A computer monitor displays a cryptocurrency exchange interface with various graphs, charts, and numerical data. On the left side, there are options for buying and selling, as well as a list of recent trades. The main graph on the right shows a price chart with a candlestick pattern, indicating fluctuations in the market over a period of time.
A hand holds a smartphone displaying a cryptocurrency portfolio with various assets including Decentraland, Ethereum, Bitcoin, Algorand, and Polygon. The balance for each asset is shown alongside icons representing each cryptocurrency.
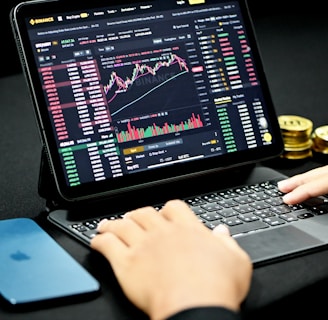
A person is typing on a laptop keyboard while looking at a cryptocurrency trading platform displayed on a tablet screen. Charts and price data are visible. Nearby is a smartphone and a stack of gold coins on the desk.
A person is using a smartphone to view a financial market chart. The screen displays a candlestick chart with green and red bars, likely indicating cryptocurrency or stock prices. The person appears to be seated, wearing casual clothes like shorts and holding the phone in both hands.

For every moonboy and degen, this is your space.

This blog is a lifesaver for those who felt the sting of buying high and selling low. A must-read for every moonboy and degen!

Crypto Fan

A shiny gold coin featuring the Bitcoin logo is placed next to a colorful, geometric crystal. The background includes branding elements with the Binance logo and the word 'executium'. A faint chart is visible in the background, indicating a financial or trading context.

★★★★★